Changing blog April 30, 2009
Posted by tumaix in planetkde-tomazcanabrava.add a comment
Since the Live Blue group is getting some popularity, growing in a way that I cannot control it anymore, I’m quitting my old blog and moving to Live Blue one.
For those of you that doesn’t know what the hell is the Live Blue group, we are a group of ~30 people, students, professors, users and curious people that use, program, test and do things with opensource.
Devoted to (but not only to) KDE programming, we have 2 projects on GSoC this year: Sandro Andrade’s Static Code Visualization in KDevelop project, and I’m mentoring Mahfuz on the Mancala game.
Let it grow 😉
GSoC: what does your code look like ? April 23, 2009
Posted by Sandro Andrade in gsoc2009, planetkde-sandroandrade.4 comments
Hi everyone,
I’m really very glad to join the KDE/KDevelop community as a GSoCer. My proposal relates to implementing visual paradigms for software comprehension in KDevelop, so I’ll briefly describe the intended goals.
Abstract: This project aims to implement better approaches for program comprehension and developer interaction with software artefacts in KDevelop by means of code visualization mechanisms. For that purpose, I will introduce features for control flow graphs and polymetric visualization, implemented as part of an extensible framework that will facilitate the future development of new visualization paradigms (treemaps, class/package dependency, dynamic, evolution etc).
Motivation / Goal: Software is inherently intangible and invisible. Information visualization and software visualization mechanisms contribute to better understand software concepts, structures, and functions by evoking mental images that convey information through the human visual system into the human brain, regarding technical and cognitive idiosyncrasies.
Understanding how software artefacts implement functionalities and collaborate with each other is quite an important prerequisite for software evolution activities. In large and complex systems, browsing source-code and reading rarely provided documentation usually do not facilitate the rapid comprehension of aspects such as static and dynamic behaviour, evolution, metrics and architectural concerns.
Software visualization approaches can be categorized into three distinctive groups: static visualization, dynamic visualization, and evolution visualization. Static visualization deals with static parts and relations of the system which can be visualized without running the program, like source-code, data structures, static call graphs, and system modules. Dynamic visualization shows the behaviour of a program for a given input and has successfully been used for algorithm animation, architecture visualization augmented with run time information, and visual debugging and testing. Evolution visualization depicts how software changes over the time usually based on metrics such as code age, number of bug fixes, structural change, and evolutionary coupling.
Figure 1 shows some commonly used visualization paradigms (from top to bottom / left to right): control flow graphs, polymetric, treemaps, hyperbolic trees, euclidean conetrees, and citylizer. Each particular visualization paradigm is properly recommended for analysing a specific data type (2D, 3D, hierarchical, etc) and provides different navigation functionalities.


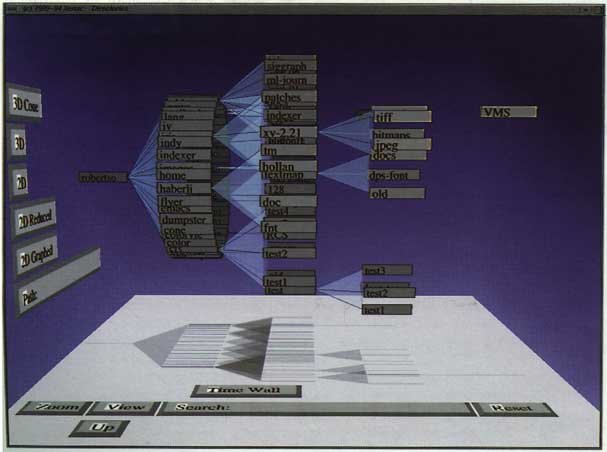

Figure 1: software visualization paradigms
My ultimate goal is to design and implement an initial support for software visualization in KDevelop. By the end of the project I expect to implement two paradigms for static visualization: control flow graphs and polymetric visualization. The expected implementation should be based on an extensible framework designed to set the stage for future implementation of new visual paradigms. In the next sections I present a brief description of control flow graphs and polymetric visualization.
Control Flow Graphs
Control flow graphs, and call graphs in particular, are directed graphs that describe calling relationships between computation modules in a system. Call graphs can be a record of an execution of the program (dynamic call graphs) or can represent every possible run of the program (static call graphs). Figure 2 depicts the call graph produced by the profiling tool KCachegrind.

Figure 2: call graph visualization in KCachegrind
Call graphs have successfully been used for a range of purposes: human understanding of programs, data flow analysis, and detection of procedures that are never called, that represent recursive calls, and that implement infinite loops. Implementing call graphs generation and visualization tools requires the use of algorithms for source-code parsing, graph drawing layout, call graph navigation (pan, zoom, sub-branching) and call graph interaction (going to source-code from visualization and vice-versa).
Polymetric Visualization
The polymetric visualization paradigm has been successfully implemented in the Malnati’s X-Ray project and constitutes a major feature for metric-based program comprehension. In such approach class hierarchies are represented by connected rectangles and metrics extracted from source-code define the values of geometric parameters used in the visualization. Figure 3 shows a polymetric view where the width of the rectangle represents the number of methods implemented in that class, while the height of the rectangle represents the number of lines of code (LOC) of the whole class.

Figure 3: geometry-related metrics in the polymetric paradigm
A number of source-code metrics can be associated to different visual attributes like colour, shape or movement. For example, class age could be associated to rectangle’s colour representing recently modified classes in red and older ones in blue.
Such association to visual attributes improves software comprehension considerably: long and thin rectangles usually indicate classes with lower cohesion (high number of responsibilities), deep inheritance trees are usually an evidence of poor design raising issues like the fragile base class, recently modified classes representing unstable or untested code are easily identified etc.
Implementation Details: In KDevelop architecture, representation of source-code structure is achieved in a language-independent way by the use of the Definition-Use (DU) Chain. The expected visualization module should interact with DU Chain and keep a synchronized visual representation of code structure. The DU Chain implementation should be checked for the presence of the required information (number of methods and #LOC per class, class dependencies etc). Investigation will be performed into use of some higher level graph drawing libraries, such as QAnava, Qt/AI or Umbrello. Some interaction should be provided between the implemented visualizations and code browser, as well as basic navigation mechanisms (pan, zoom, sub-branching). The implementation should consider scalability issues when visualizing large scale projects.
Expected deliverables and success criteria: Required deliverables: extensible framework for software visualization, control flow graphs visualization, polymetric visualization, basic navigation functionalities.
Optional deliverables: configurable association of metrics to visual attributes, linking with the debugger and/or callgrind tools, another visualization paradigms.
Success criteria: code quality (modular and extensible framework), comprehensive documentation, stable implementation with scalability support for visualization of large systems, and timeliness.
I hope to have good news to announce soon !
Yes, we have GSoCers ! April 22, 2009
Posted by Sandro Andrade in gsoc2009, planetkde-sandroandrade.add a comment
On April 20th 19:00 UTC, just a few seconds before 840 insane users in #gsoc irc channel would have gotten through a nervous attack, Google announced the list of accepted student proposals for Google Summer of Code 2009 (GSoC 2009). 1000 students from 70 countries are now celebrating their acceptance into more than 150 Free and Open Source software projects. We are proud to be one of the top 5 countries for accepted student applicants: United States (212), India (101), Germany (55), Canada (44) and Brazil (43).
We are also very excited to have two Live Blue members accepted for participation in GSoC 2009. The project “Static Code Visualisation in KDevelop” by Sandro Andrade (Brazil – Live Blue) will be mentored by Aleix Pol (Spain) and aims to implement better approaches for program comprehension and developer interaction with software artefacts in KDevelop by means of code visualisation mechanisms. Tomaz Canabrava (Brazil – Live Blue) will mentor the project “Mancala Game with an Interactive Interface” by Mahfuzur Rahman (Bangladesh). Mahfuzur Rahman will implement a family of board games played mostly in Asia and Africa, as part of KDE Games Project.
We hope to have good news to announce soon !
Live Blue takes responsibility for the KDE Brasil web site April 21, 2009
Posted by Sandro Andrade in planetkde-sandroandrade.add a comment
From some time br.kde.org, the Brazilian KDE web site, has been maintained in a slow pace due to duties that KDE fellows Hélio de Castro, Maurício Piacentini, Felipe Arruda, and other translation guys are into. We are very glad to take maintenance activities for br.kde.org. Many thanks to Felipe for the previous maintenance task. We are committed to do our best to bring updated information about KDE status and to make br.kde.org reflect the personality of Brazilian community.
Live Blue launched ! April 13, 2009
Posted by Sandro Andrade in planetkde-sandroandrade.2 comments

We are proud to announce the creation of Live Blue KDE working group: a Brazilian effort to promote, develop, document, and translate KDE-related free and open source software. The Live Blue group comes from the work of Sandro Andrade and Tomaz Canabrava which have been promoting the Qt/KDE experience in Brazilian open source meetings, such as FISL – International Forum on Free Software and Latinoware – Latin-American Conference on Free Software. In spite of meaningful promotion and distribution work done by Brazilian open source community we have noticed a still modest contribution to developing activities. Live Blue aims to support the first steps of new developers towards KDE world by lecturing introductory C++/Qt/KDE short courses, by investigating potential new KDE projects, and by helping to maintain already existing projects. Although we are focused on coding activities, efforts related to documentation, translation, testing, art, and promotion are quite welcome.
Live Blue members live in Salvador, a very pleasant city and capital of Bahia state in northeast Brazil. We hope our always shining sun and marvellous beaches contribute a lot to the KDE hacking way of live.
